Angelo Cani
Data Analyst & Microsoft Certified Trainer
If you are here, you want to know more about me, right?Let me show you a bit!

I believe that professional results are more important than certifications, but... I also have them!Click below to see the certificates:


PowerBI Alteryx Tableau Fabric
Below you can also find a bit of my work, created specifically for this portfolio, as most work I have done up to this date are under NDA's.
Steam Game Discovery Hub: A Deep Dive into the ProcessFor this project, my goal was to build more than just a dashboard; I wanted to engineer a complete, end-to-end data solution that mirrors a real-world analytics workflow.Data Sourcing Strategy:Instead of using a pre-made Kaggle dataset, I chose to source data directly from the Steam Web API. This approach gave me full control over the data points and allowed me to develop a custom Python solution for data extraction. To manage Steam's API limitations (a 4-day process for a full pull), I engineered a resilient, batch-processing script that handled API rate limits and connection errors. As a final step, a second validation script cross-references the initial pull to enrich the dataset and ensure completeness.Data Modeling & Transformation:Once the data was collected, I loaded the raw CSV into Power BI. Using Power Query, I architected a robust Star Schema with one central fact table and five dimension tables. This professional modeling approach was critical for splitting multi-value fields (like genres, categories, and developers) into separate rows, which not only optimized performance but also enabled the complex, interdependent filtering required for the report.Design & Execution:The visual design uses Steam's native color palette (#171a21, #66c0f4) to create an authentic and intuitive user experience. From initial concept to the final, interactive tool, the project showcases a full-cycle development process.This project was developed in just 2 days! (Aside the API running time)And below is the result, feel free to interact with it, and at the table, right click on any game to drill-through and see details:
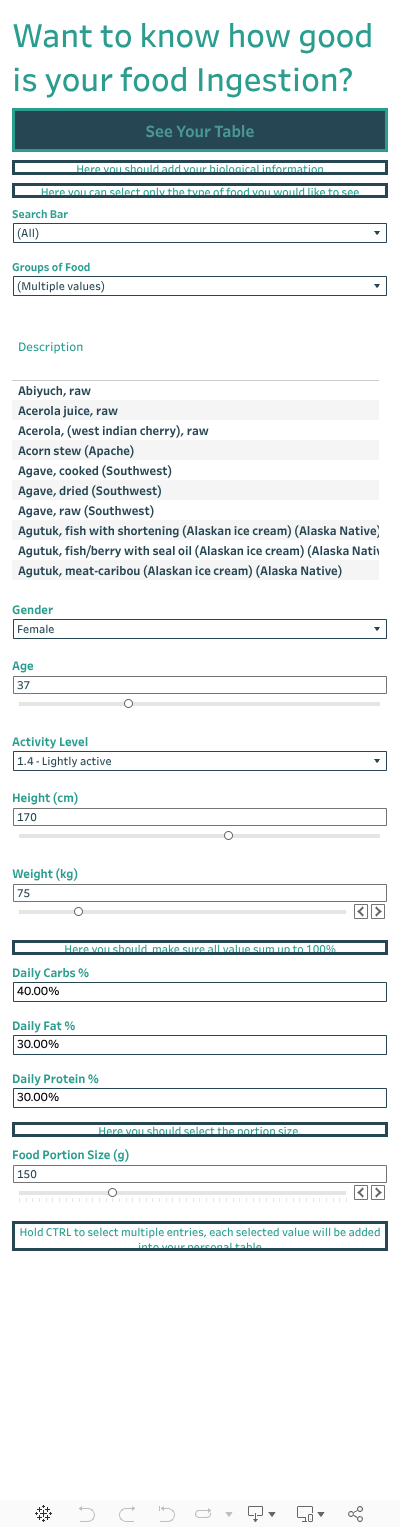
If you don't have a PowerBI account, see images below:
Longevity & Nutrition Research Tool: A Guided Analytics ApplicationThe goal of this project was to create a personalized, research-grade tool to help users navigate complex nutritional data. Instead of a static report, I built an interactive application in Tableau that provides personalized recommendations based on scientific formulas and user-defined goals.Data Foundation & Modeling:The credibility of this tool relies on its data. I sourced the complete dataset directly from the U.S. Department of Agriculture (USDA) FoodData Central, ensuring all calculations are based on an authoritative, scientific standard. Within Tableau, I created a clean, relational data model by joining the core food, nutrient, and nutritional value tables, and applied a global filter to isolate the high-quality SR Legacy dataset of foundational ingredients.Personalization Engine:The core of this application is its personalization engine, built using Tableau's advanced features:
Parameters: I implemented a suite of user-controlled parameters for personal metrics like age, weight, height, and activity level.
Calculated Fields: These parameters dynamically feed into a series of complex calculated fields that use the Mifflin-St Jeor equation to determine the user's unique Basal Metabolic Rate (BMR) and Total Daily Energy Expenditure (TDEE), providing a scientific baseline for their caloric needs.Guided Analytics & User Experience:The dashboard guides users toward their goals. Using Tableau Set Actions, I created an interactive "Meal Builder" where users can select multiple foods with custom portion sizes. The dashboard provides instant, dynamic feedback through color-coded visuals, showing users precisely how their selections measure up against their calculated macronutrient targets. This transforms the dashboard from a passive view into an active decision-making tool.The looks are not that great, but the features certainly are!
I also have many more small projects from MakeoverMonday, which were a series of challenges showing what can you do in one hour! From gathering the data source, loading the data into Tableau and show some findings within the one hour time limit.Click below or here to access it!
If you haven't seen my intro video, I also believe communication is key. I believe that I have great communication skills, and have been doing both dashboard presentations, and trainings on all the tools I work with.
But I can also do it in other languages: